Responsible AI development in RAI
As the use of AI in various segments of the industry rapidly grows, responsible AI is garnering increased attention from both the AI research community and the industry. In fact, many AI pioneers and well-known advocates have emphasized the need for establishing a reliable, fair, transparent, and robust set of standards and practices for AI development. Responsible AI (RAI) has been designed to simplify the evaluation of AI models for developers and data scientists from various perspectives of responsible AI development. RAI offers a unified framework for evaluating AI models not only based on performance but also considering bias and fairness, robustness, and trustworthiness of AI models. To do this, it gathers various types of metrics from multiple open-source libraries in an easy-to-use and interactive manner. Below, we outline some of the metric categories related to responsible AI development.
Basic Robustness
Model robustness refers to the degree that a model’s performance changes when using new data versus training data.
display_name |
Description |
|---|---|
Normalized Features 0-1 |
Whether of not each training feature is normalized to 0/1. |
Normalized Features Standard |
Whether of not each training feature is normalized to standard. |
Basic Robustness

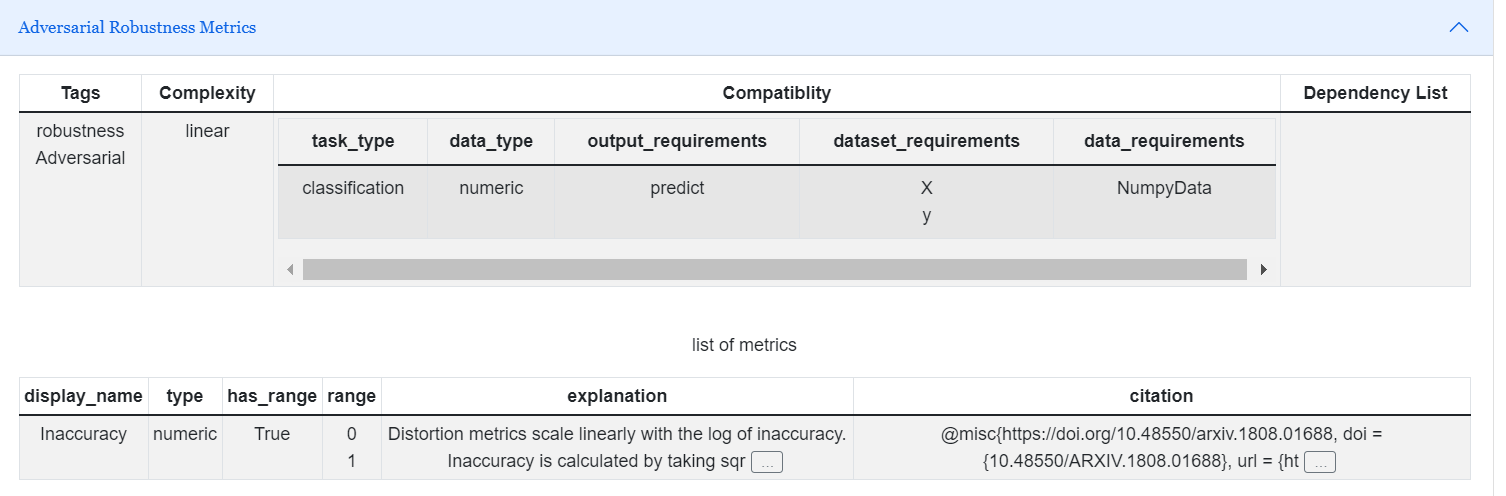
Adversarial Robustness
Adversarial robustness is the ability of an AI model to resist being fooled by a series of carefully crafted changes to its input data.
display_name |
Description |
|---|---|
Accuracy |
Distortion metrics scale linearly with the log of inaccuracy. Inaccuracy is calculated by taking sqrt(1 - accuracy). |
Adversarial Robustness
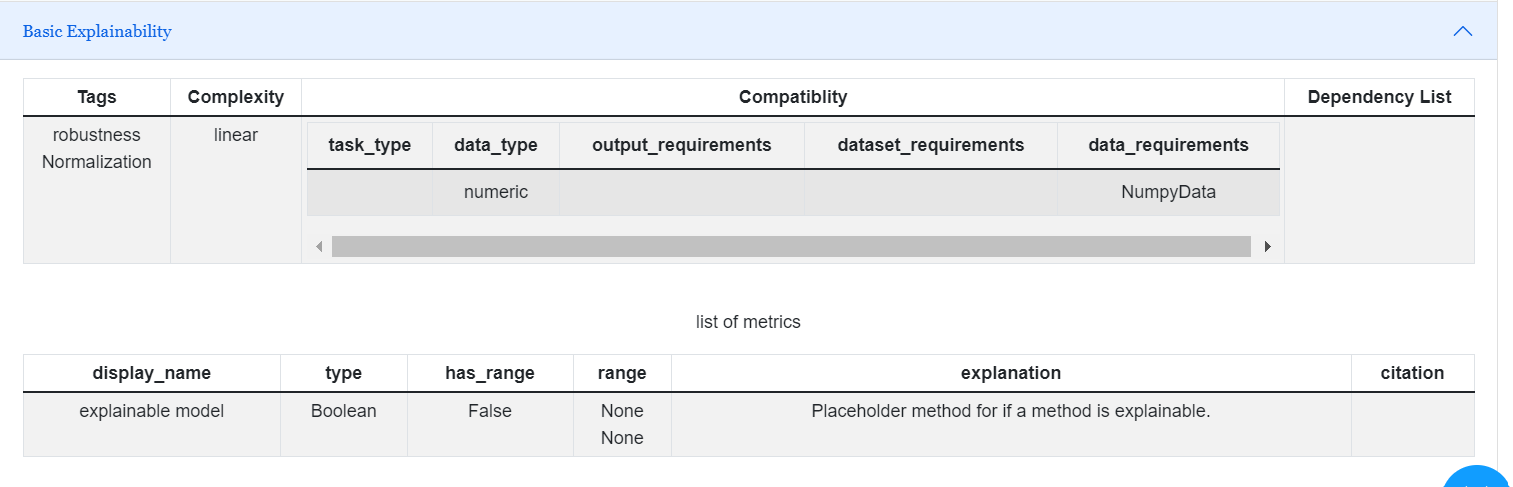
Basic Explainability
Basic Explainability will assist in providing details on or causes of fairness metrics.
display_name |
Description |
|---|---|
explainable model |
Placeholder method for if a method is explainable. |
basic Explainability
Performance
Performance metrics are a part of every machine learning pipeline. They tell you if you’re making progress, and put a number on it. All machine learning models, whether it’s linear regression, or a SOTA technique like BERT, need a metric to judge performance.
The Torch library is used in our implementation of performance metrics in order to take advantage of some of its features.
Performance Metrics
display_name |
Description |
|---|---|
Accuracy |
The proportion of correct predictions among the total number of cases processed. |
Balanced Accuracy |
Describes the proportion of correct predictions averaged across each label. |
False Positive Rate |
Describes the percentage of negative examples incorrectly predicted to be positive. |
Classification Performance Metrics

Fairness
Fairness measures allow us to assess and audit for possible biases in a trained model. There are several types of metrics that are used in RAI to assess a model’s fairness. They can be classified as follows:
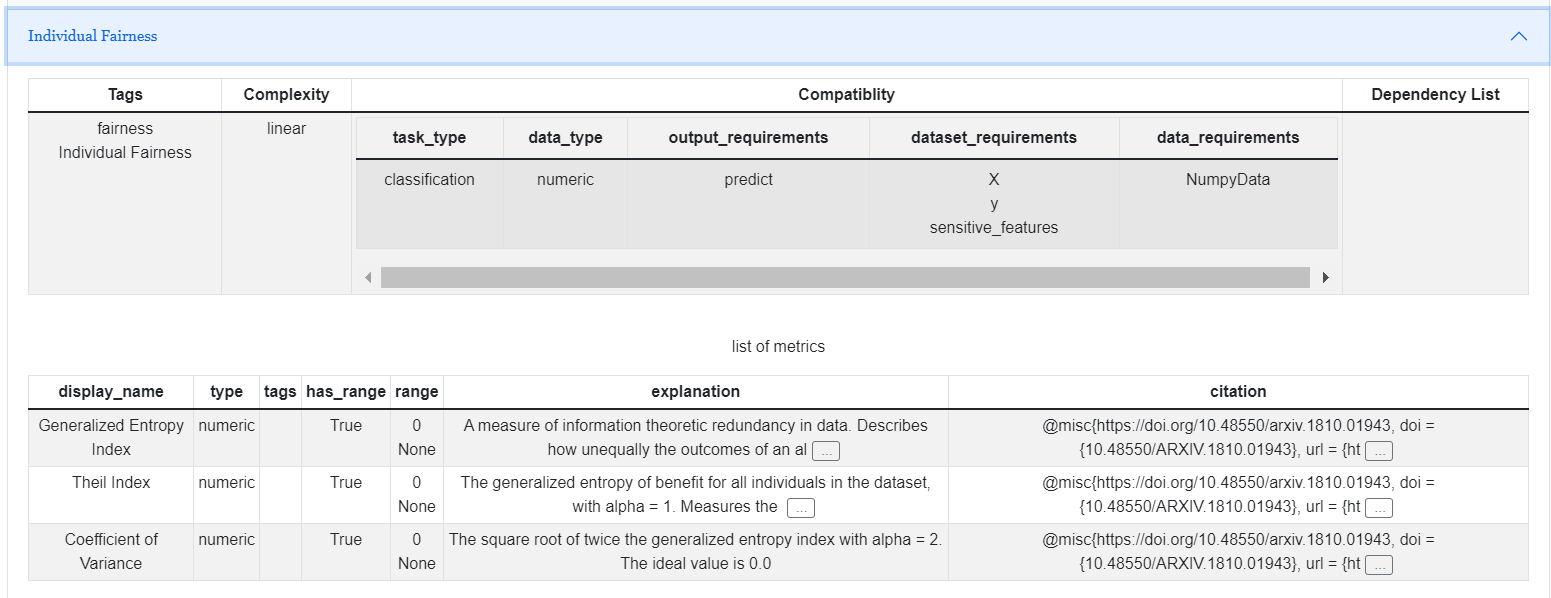
Individual Fairness
The goal of similar individuals receiving similar treatments or outcomes.It is used to compute metrics related to individual fairness in AI system.
display_name |
Description |
|---|---|
generalized_entropy_index |
A measure of information theoretic redundancy in data. Describes how unequally the outcomes of an algorithm benefit different individuals or groups in a population |
theil_index |
The generalized entropy of benefit for all individuals in the dataset, with alpha = 1.nMeasures the inequality in benefit allocation for individuals. nA value of 0 implies perfect fairness |
coefficient_of_variation |
The square root of twice the generalized entropy index with alpha = 2. nThe ideal value is 0. |
Individual Fairness
Group Fairness
It is the goal of groups defined by protected attributes to receive similar treatment or outcomes regardless of their protected attributes.
display_name |
Description |
|---|---|
disparate_impact_ratio |
The ratio of rate of favorable outcome for the unprivileged group to that of the privileged group. nThe ideal value of this metric is 1.0 A value < 1 implies higher benefit for the privileged group and a value > 1 implies a higher benefit for the unprivileged group. |
statistical_parity_difference |
The difference of the rate of favorable outcomes received by the unprivileged group to the privileged group. nThe idea value is 0.0 |
between_group_generalized_entropy_error |
The between group decomposition for generalized entropy error |
equal_opportunity_difference |
The difference of true positive rates between the unprivileged and the privileged groups. nThe true positive rate is the ratio of true positives to the total number of actual positives for a given group. nThe ideal value is 0. A value of < 0 implies higher benefit for the privileged group and a value > 0 implies higher benefit for the unprivileged group |
Group fairness

General Prediction Fairness
For the classification model to be fair, various fairness metrics need to be computed..
display_name |
Description |
|---|---|
average_odds_difference |
The average difference of false positive rate (false positives / negatives) and true positive rate (true positives / positives) between unprivileged and privileged groups. nThe ideal value is 0. A value of < 0 implies higher benefit for the privileged group and a value > 0 implies higher benefit for the unprivileged group |
between_all_groups_coefficient_of_variation |
The square root of twice the pairwise entropy between every pair of privileged and underprivileged groups with alpha = 2.nThe ideal value is 0 |
between_all_groups_generalized_entropy_index |
The pairwise entropy between every pair of privileged and underprivileged groups. nThe ideal value is 0.0 |
between_all_groups_theil_index |
The pairwise entropy between every pair of privileged and underprivileged groups with alpha = 1.nThe ideal value is 0.0 |
General prediction Fairness

Dataset Fairness
It is used to compute fairness metrics for the Binary dataset.
display_name |
Description |
|---|---|
base_rate |
Base Rate is the rate at which a positive outcome occurs in Data. In formula it is, Pr(Y=pos_label) = P/(P+N) |
num_instances |
Num Instances counts the number of examples in Data |
num_negatives |
Num Negatives counts the number of negative labels in Data |
num_positives |
Num Positives calculates the number of positive labels in Data |
Dataset Fairness

For Instance:
Using RAI to measure group fairness:

fairness_of_the_model
A case study of how RAI can be used to detect and resolve biases in AI models can be found here.