Dashboard
The goal is to provide a generic framework to perform various types of analysis, from data quality assessment to model selection based on performance, fairness, and robustness criteria.
RAI Dashboard features
RAI dashboards display metrics and critical data and give the user a visual representation of them.
The RAI dashboard computes all metrics and visualizes the currently running code in real time.
RAI dashboard can handle a wide variety of models and store information for each model, from text-based models to image-based models.
RAI dashboard automatically determines what metrics are relevant by examining the type of model, data, and task provided by the user.
With RAI, users can view data at a high level by scanning dashboards like input and output visualizations.
How To Run RAI Dashboard
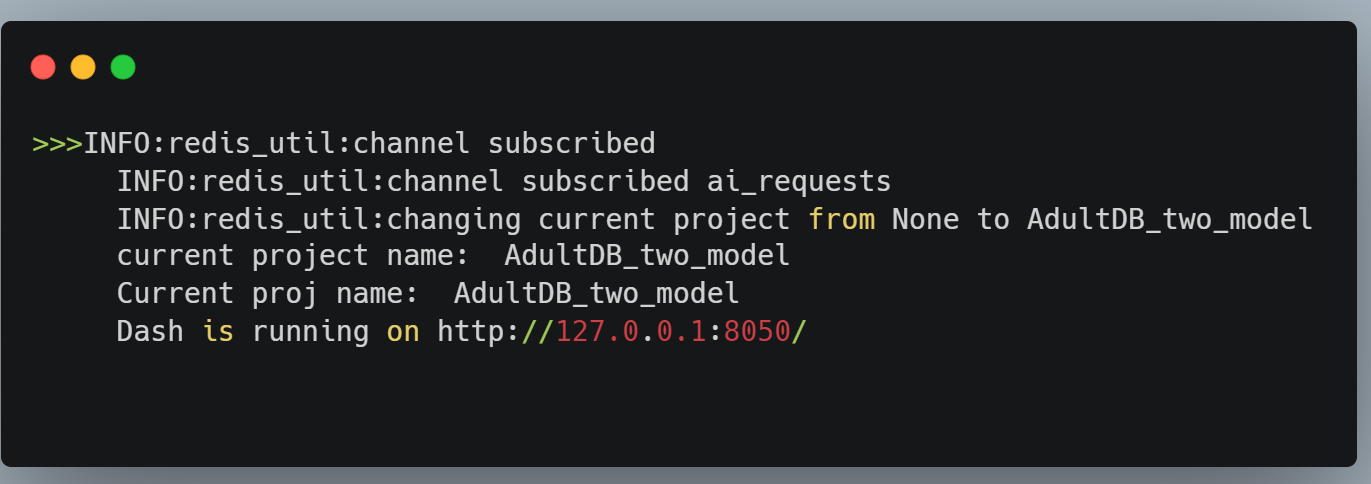
When the python file
main.pyis ran, Dash is running on localhost and the port is 8050, if we follow and click on the URL or copy the URL and paste in the browser, you can access the dashboard.
Description: Run the main.py by
 Dashboard> python .\main.py

-Click the following link to access Dashboard.
-Dash is running on ...
Example:
Interaction of RAI Dashboard
How it links to RAI project (via sqlite..)

RAI Dashboard Homepage.
How it shows the Metrics, Certificates and Analysis page
Metrics:

Metric Details Page.
Certificates:

Certificate Page.
Analysis:

Analysis Page.